
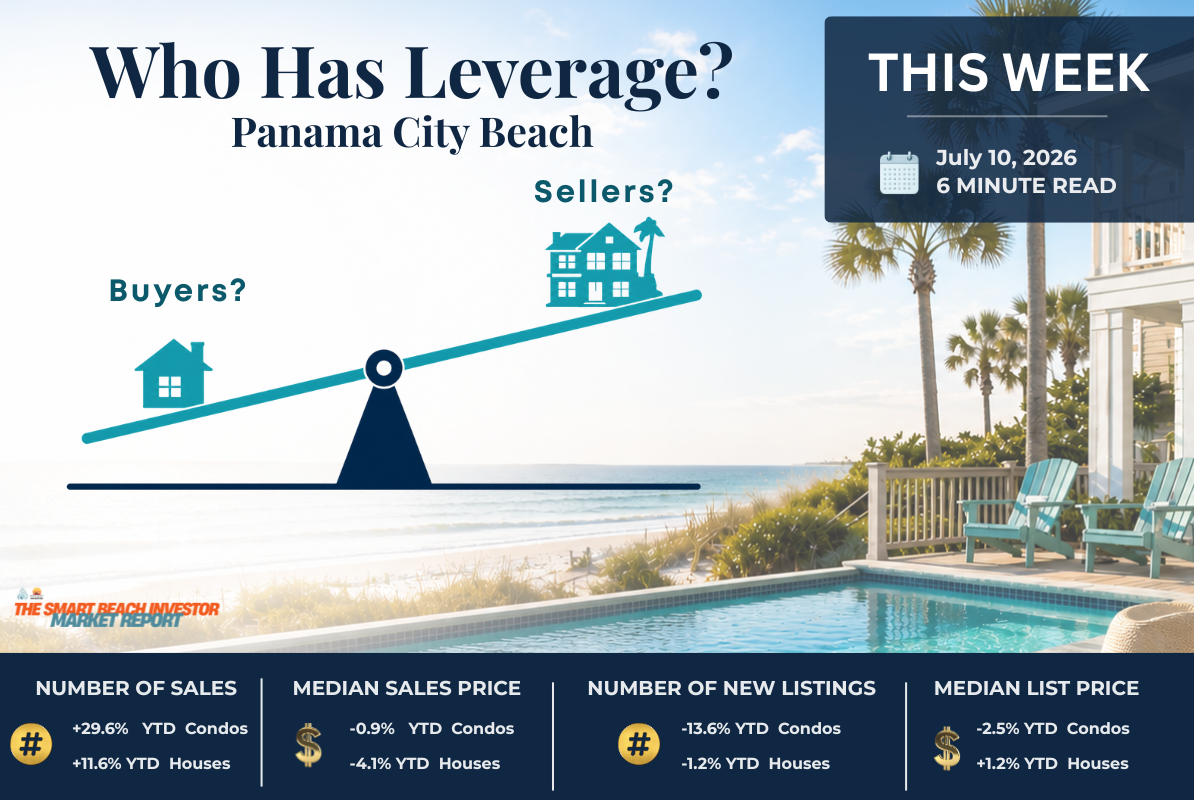
Both sides having to negotiate. That almost never happens at the beach.
I’ve been selling real estate here for more than 20 years, and I can count on one hand the number of times this market has actually been balanced. For most of my career, one side or the other has controlled the table — sellers demanding top dollar and getting bidding wars, or after the Great Recession, buyers picking through foreclosures while prices fell. Very little room to negotiate, ever, no matter which side was winning.
That’s not what’s happening right now.
Today, on Panama City Beach, buyers and sellers are actually having to negotiate to put deals together — and keep them together. But because the demand-to-supply ratio here almost always favors sellers eventually, I don’t expect this trend to last long. We’re already seeing the condo inventory getting absorbed which will swing leverage toward sellers. I expect the same for the homes market.
What happens as we move through summer and into fall will depend a lot on the Iran conflict and how long the mortgage “lock-in effect” keeps sellers from listing. Let’s look at both the condo and home markets, and how to navigate each one whether you’re an owner, buyer, or seller.
Panama City Beach Condo Market
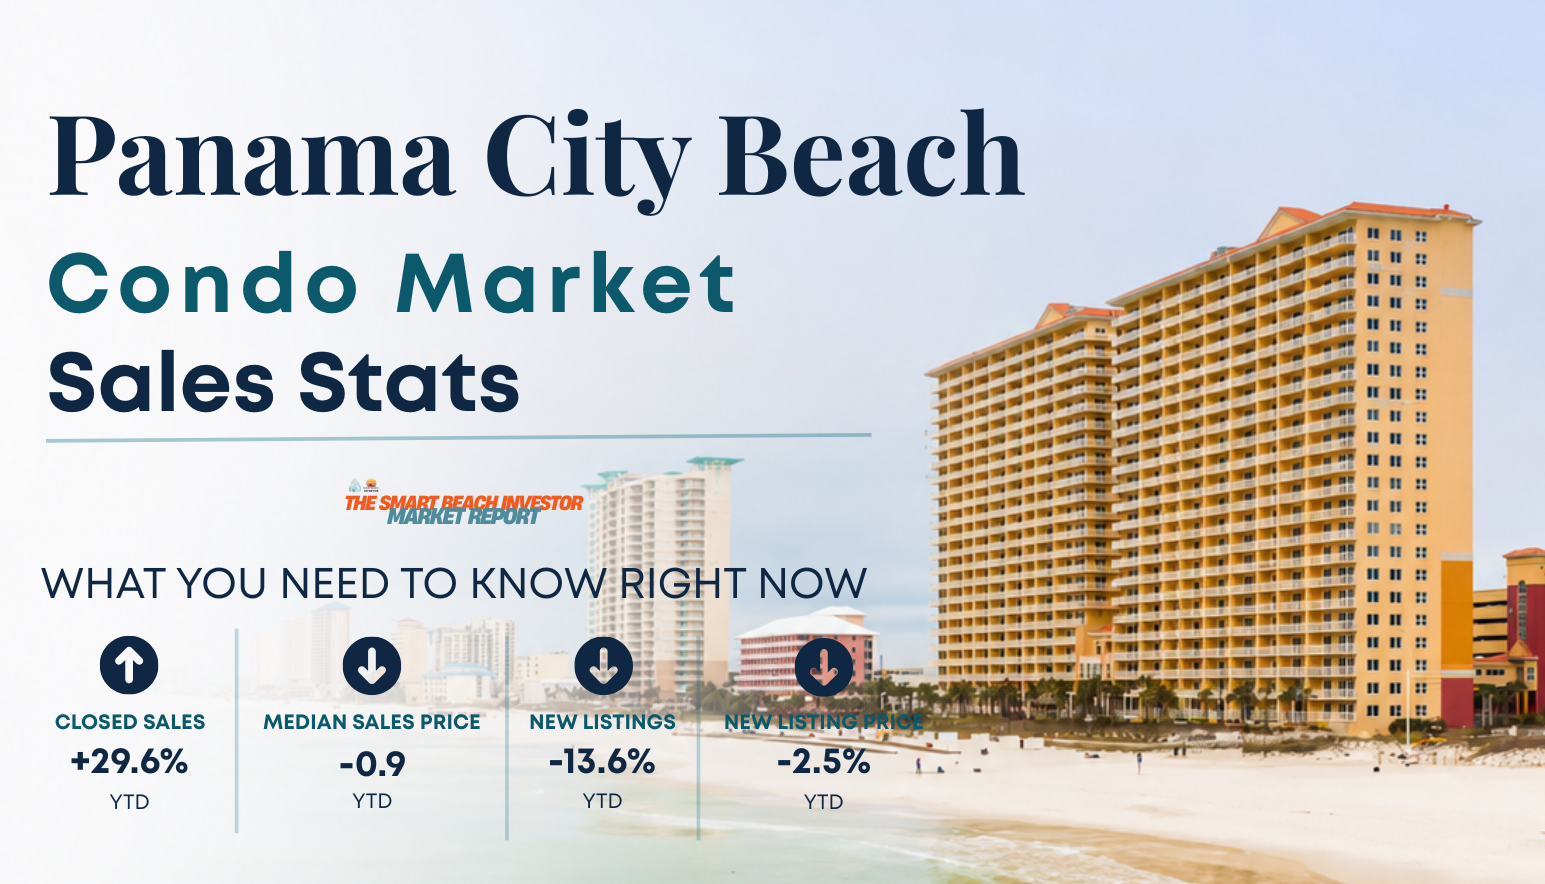
The story is all about surging buyer absorption and a steady clean-up of excess inventory. Properties are changing hands rapidly, inventory is shrinking, and we are seeing a very clear price floor around $367,500.
Demand Closed Sales YTD: Up 29.6% — 422 closed sales in 2025 versus 547 so far this year. 5 of the first 6 months saw double digit increases in closed sales volume. That is a market on fire.
Sales Price Median Sales Price YTD: Down Slightly 0.9% — from $371,000 last year to $367,500 this year. 4 of the first 6 months have seen YoY increases so if the market hasn’t bottomed, it seems close.
Supply New Listings YTD: Down 13.6%, meaning buyer options are shrinking. Additionally, Median List Price are down year over year -2.5%: $395,000 then, $385,000 now. Again, it seems a bottom is close.
If You Own a Condo
The condo market can be pretty finicky so I recommend that you avoid passive ownership — it’s always a good time for proactive defense of your asset.
-
- Audit your HOA immediately. SIRS deadlines are already affecting values. Sit down with your HOA and review the building’s reserve funding strategy in detail.
- Weigh your cash flow against rising costs. With the ban on reserve waivers now in full effect, HOA dues and master insurance are climbing and squeezing your rental ROI. Compare your rental income to your rising non-debt carrying costs.
- Know which tier you’re in. A building with solid, fully funded reserves that’s cleared its engineering milestones holds its value. A building under 30% reserve funding should be preparing financially for a special assessment or a real jump in monthly fees.
If You’re Buying a Condo
If you are hunting for a cash-flowing beach condo or a second home, this data tells you that Panama City Beach is the value play of the Emerald Coast, but the inventory cushion is thinning out.
- SIRS compliance is your leverage. Before you fall for a view or a pool, ask your agent: “Can I see this building’s completed SIRS report and current reserve balances?”
- Use days-on-market as leverage. Longer DOM usually means room to write value-driven offers. Look for sellers facing upcoming assessment deadlines.
- Treat non-compliant or underfunded buildings as cash-only, high-risk plays — financing will be difficult. Favor well-managed, fully compliant buildings, even at a smaller discount. You’ll sleep better without a surprise assessment next year.
If You’re Selling a Condo
If you are planning to list or currently selling a condo in PCB the window is open, but leave your ego behind. The buyers in this market are very smart. They are hunting for properties where sellers have already adjusted to reality. Here’s the thing, if you match the current market pricing rhythm and price realistically from day one, the massive volume of buyers means your unit will sell quickly.
- Fewer Competitors, But Smart Buyers: New listings are down 13.6%. You are competing against fewer newly listed properties, which gives you breathing room.
- The “List Price vs. Reality” Trap: Look at June 2026. Sellers launched properties with a median list price of $349,900 (down 15.7% from last June), but properties actually closed with a median sold price of $353,000.
Is Your Condo an A, B or C Property?
What category does your building fall into? Click below to check your property’s position before the fall slowdown.
Panama City Beach Homes Market
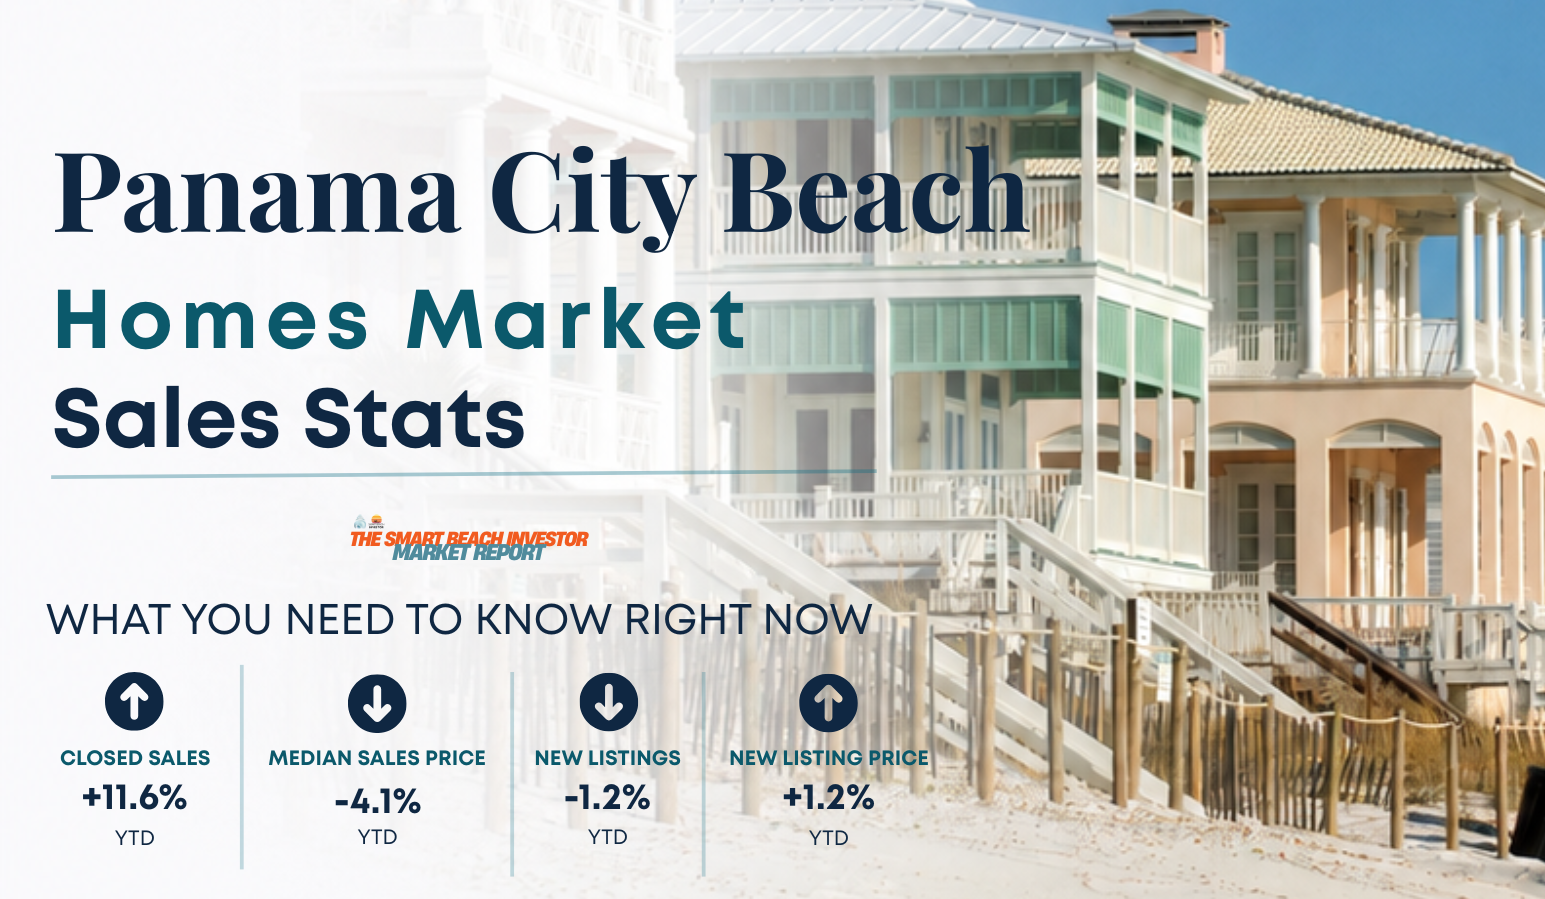
The Panama City Beach homes mareket is recovering on the transaction side, but not yet a recovering price market. It isn’t a buyer’s market like 2009 and it isn’t the frenzy of 2021. It’s closer to a balanced market that slightly favors buyers.
Demand Closed Sales YTD: Up 11.6% — 464 closings last year versus 518 so far this year. That’s healthy.
Sales Price Median Sales Price YTD: Down 4.1% — from $490,000 last year to $470,000 this year.
Supply New Listings YTD: Down 1.2% — 975 new listings so far this year versus 987 last year.
List Price Median List Price YTD: Up 1.2% — sitting at $549,000.
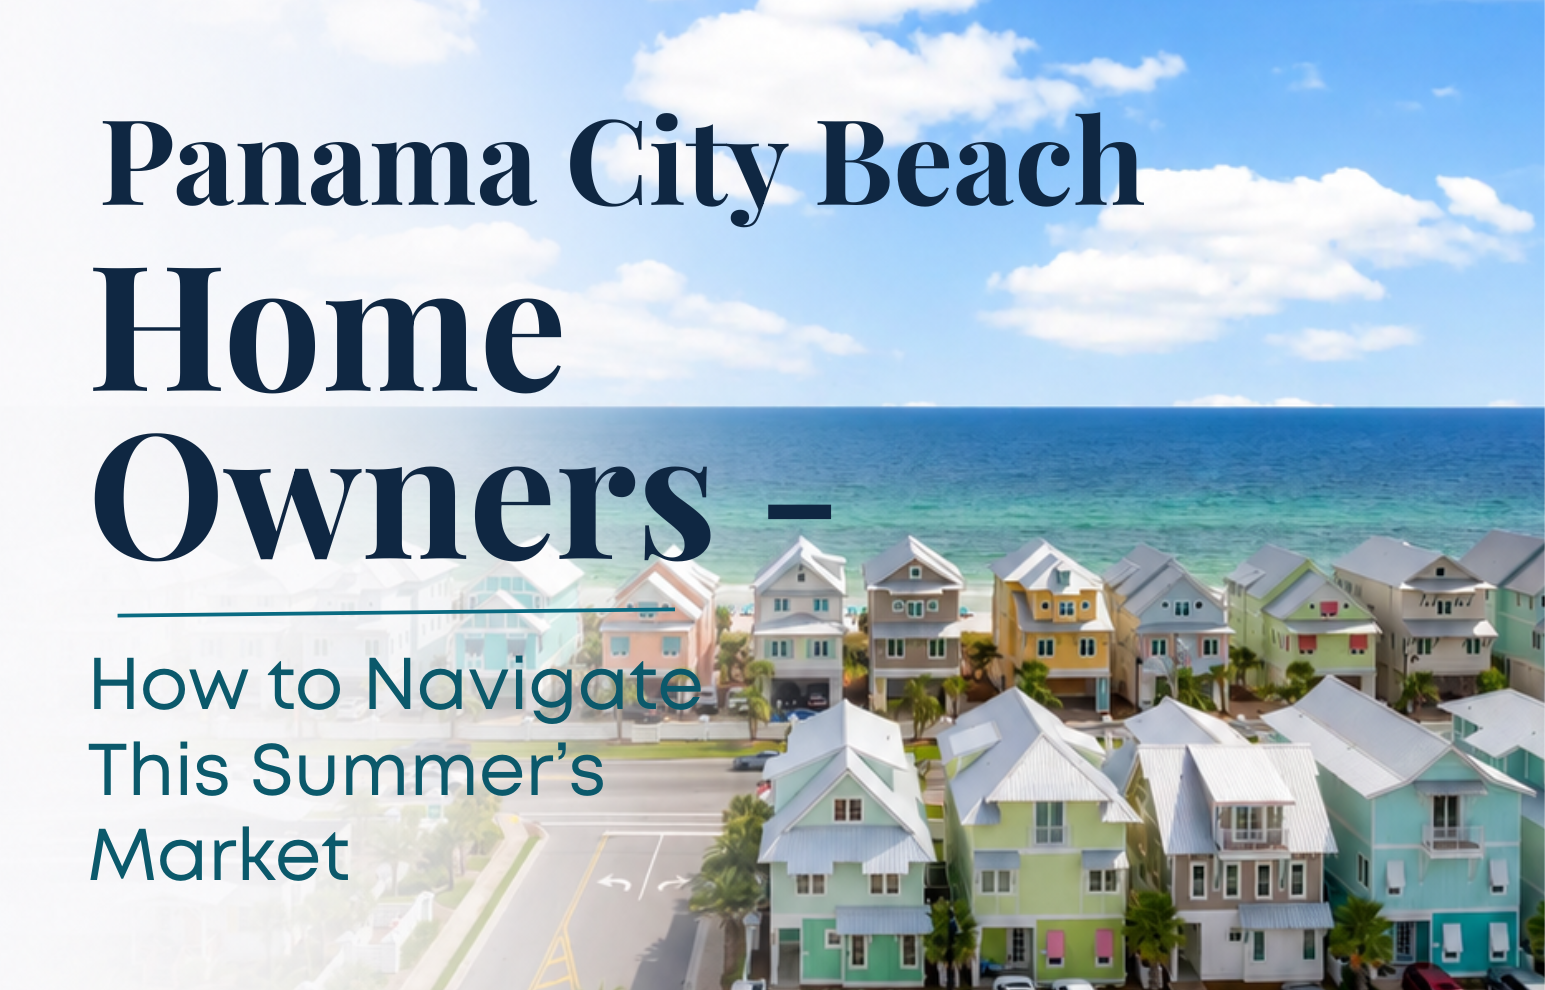
If You Own a Home
Your home’s value has remained remarkably resilient considering the dramatic increase in inventory we’ve seen over the past couple of years. While prices have softened some from last year, buyer demand has actually improved. More homes are selling than they did a year ago. That’s encouraging because real estate markets generally recover in this order:
- Transactions improve
- Inventory stabilizes
- Prices recover
Panama City Beach appears to be in that first stage.
If You’re Buying a Home
The window of opportunity is open for—but it may not stay open forever. Buyers still have more choices and stronger negotiating leverage than they’ve had in years, but sales activity is quietly gaining momentum. Closed sales are up nearly 12% year over year, which tells us that more buyers are recognizing the value available in today’s market. History shows that transaction volume often recovers before home prices do. For buyers waiting for the “perfect” moment, today’s combination of increased listings, lower prices, and improving demand may one of best opportunities we’ve seen in quite some time.
If You’re Selling a Home
Demand has returned, but buyers have become much more selective. Homes that are priced correctly, well presented, and effectively marketed continue to sell. Those that aren’t are likely to sit while buyers move on to better values.
Find Out Where You Actually Stand
Every section above comes back to the same question: is your specific property in the “A” tier capturing this market, or the “B/C” tier that needs a strategy to compete? A CMA can’t really answer that — ask three realtors and you’ll get three different opinions, because a CMA isn’t a measurement, it’s a guess shaped by who’s doing it and how badly they want the listing.
The SaleAbility Score is built on consistent data instead — rental performance, booking history, location, views, building health, seasonality — the same inputs, the same result, every time. It’s free, takes about two minutes, and most owners are surprised by what they find.
Whether you’re holding, buying, or selling — condo or home — this is where to start.

Final Thoughts
Whether you’re buying, selling, or holding, our job is to help you see your real position clearly — not guess at it. That’s especially true right now, in a market where the old safety nets (predictable pricing, predictable demand) have thinned out on both sides.
Get your SaleAbility Score above, or reach our team directly at 850-654-3325 to talk through where you stand.
Committed to your success,
John Moran – CEO
The Smart Beach Investor | Keller Williams Realty At The Beach Team